Choosing Core Sizes to Stock: A Simple ABC Analysis for Tyre Distributors
A simple ABC analysis for tyre stock: rank sizes by annual sales value, set your own A/B/C cut-offs and plan orders around MOQ per size. Worked example.
An ABC analysis ranks every tyre size you sell by its annual sales value, then splits the list into three groups. Group A is the few sizes that bring in most of your sales value; keep them in stock and check them often. Group C is the many sizes that bring in little; order them as needed or keep a small stock. Group B sits in between. There is no fixed rule for where to draw the lines, so set them from your own data.
This matters when you order from a manufacturer with a minimum order per size. Our tyre minimum is 300 pieces per size and pattern, and our tube minimum is 2,000 pieces per size and material. Knowing your A sizes first helps you avoid filling a container with slow stock.
What is an ABC analysis?
ABC analysis is a way of sorting stock items by how much they contribute to your business, measured in this guide as annual sales value. For each item you multiply the units sold in a year by the unit value, rank the items from highest to lowest, and add up the share each one contributes.
The result shows which items carry your business. It doesn't tell you what your customers will buy next year. It only describes what your own records show.
How do I run an ABC analysis on my tyre sizes?
You need one year of your own sales records. Then follow five steps:
List every size and pattern you sell as a separate line. A size in two patterns is two lines, because a minimum order applies to each.
Work out annual sales value for each line: units sold × unit price (or unit cost, if you prefer to rank by stock value).
Sort the lines from the highest value to the lowest.
Add a cumulative share column: each line's value added to all the lines above it, as a percentage of the total.
Choose your cut-offs for A, B and C, and mark each line.
You can do this in any spreadsheet. Repeat it when your sales change, for example once a year or before each season's orders.
A worked example
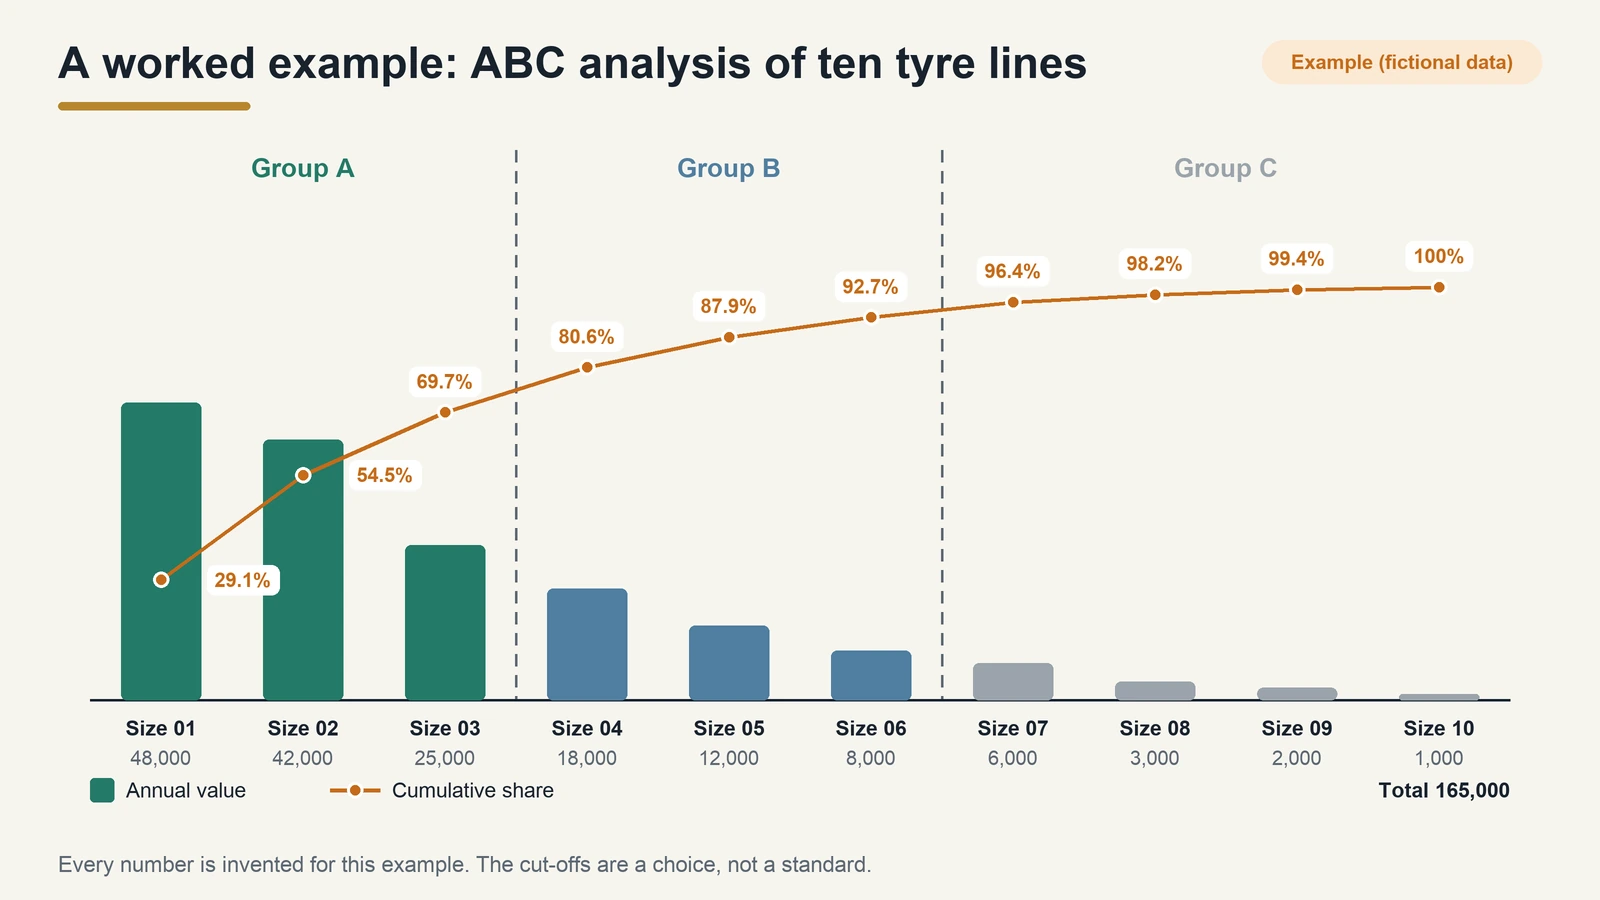
Example (fictional data). A distributor sells ten tyre lines. The sizes are shown as codes, and every number below is invented for this example. It doesn't describe any real market.
Line
Units per year
Unit value
Annual value
Cumulative share
Group
Size 01
4,000
12
48,000
29.1%
A
Size 02
3,000
14
42,000
54.5%
A
Size 03
2,500
10
25,000
69.7%
A
Size 04
1,200
15
18,000
80.6%
B
Size 05
1,000
12
12,000
87.9%
B
Size 06
800
10
8,000
92.7%
B
Size 07
500
12
6,000
96.4%
C
Size 08
300
10
3,000
98.2%
C
Size 09
200
10
2,000
99.4%
C
Size 10
100
10
1,000
100%
C
Total
165,000
In this example the distributor chose these cut-offs: lines up to about 70% of cumulative value are A, lines up to about 93% are B, and the rest are C. That puts three lines in A, three in B and four in C.
Another distributor could draw the lines somewhere else. The cut-offs are a choice, not a standard.
Where should I draw the A, B and C lines?
Look at where the cumulative share stops climbing quickly. In the example, the first three lines reach almost 70%, and the last four together add less than 8%. Natural breaks like that are a sensible place to draw lines.
Then check the result against what you know:
A size your key customer needs may belong in A even if its value is low, because running out costs you the customer.
A new size has no full year of sales yet. Decide on it separately.
A size you are dropping can go to C whatever its history.
How does MOQ per size change the plan?
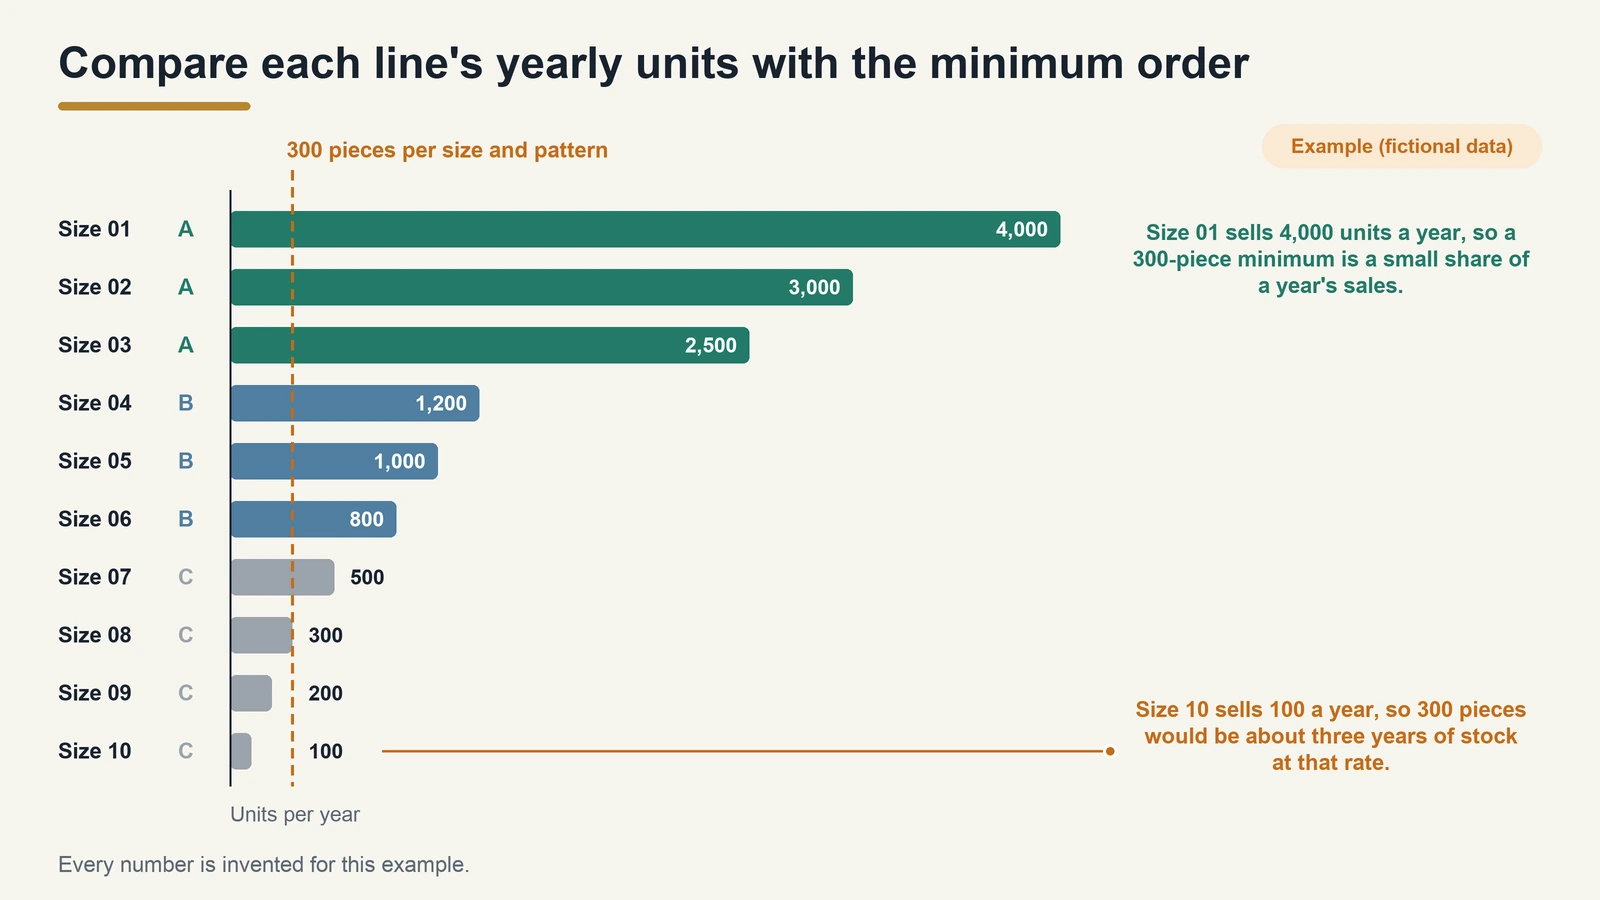
A minimum order per size turns the ABC list into an ordering plan. Compare each line's yearly units with the minimum order.
In the example, Size 01 sells 4,000 units a year, so a 300-piece minimum is a small share of a year's sales. Size 10 sells 100 a year, so 300 pieces would be about three years of stock at that rate.
That gives you a simple starting point for your own list:
Group
Suggested approach
A
Keep in stock; include in every container; check stock often
B
Stock in smaller amounts; reorder when the minimum order fits your sales
C
Order only when the minimum order matches demand, or buy from local stock
Several sizes can share one container with us, but each size still needs its own minimum: 300 pieces per size and pattern for tyres. Lead time is 20–30 days, so plan reorders of A sizes before you run low.
A method that ranks tyre sizes by annual sales value and splits them into groups A, B and C, so you know which sizes to keep in stock and which to order as needed.
Is there a standard 80/20 split for ABC classes?
No fixed split applies to every business. Set the cut-offs from your own data, for example where the cumulative share stops rising quickly.
Should I count sales by units or by value?
This guide uses value because it shows where your money is. You can run a second list by units to check sizes that sell many cheap pieces.
How often should I redo the analysis?
When your sales change, for example once a year or before each season's orders.
How does your MOQ fit an ABC plan?
Our minimum is per size and pattern for tyres (300 pieces) and per size and material for tubes (2,000 pieces). Compare each line's yearly units with that minimum before you order.
Send us your core size list
Send us your A and B sizes, patterns, TT or TL and quantities, and we will confirm the quotation. See our tyres and tubes or contact Shawn.
Sources
Source
What it supports
Checked
MOONSTAR terms (moonstarvehicle.com)
MOQ per size and pattern / size and material; lead time
2026-11-19
The worked example uses fictional data.
Written by the Moonstar export desk. Product facts follow the manufacturer's documents; figures for your order are confirmed in the quotation.
Need a quotation?
Send your sizes, quantities and destination. We confirm MOQ, lead time, packing and documents for your market.